The Complete Data Visualization Toolkit Bundle
Published 10/2022
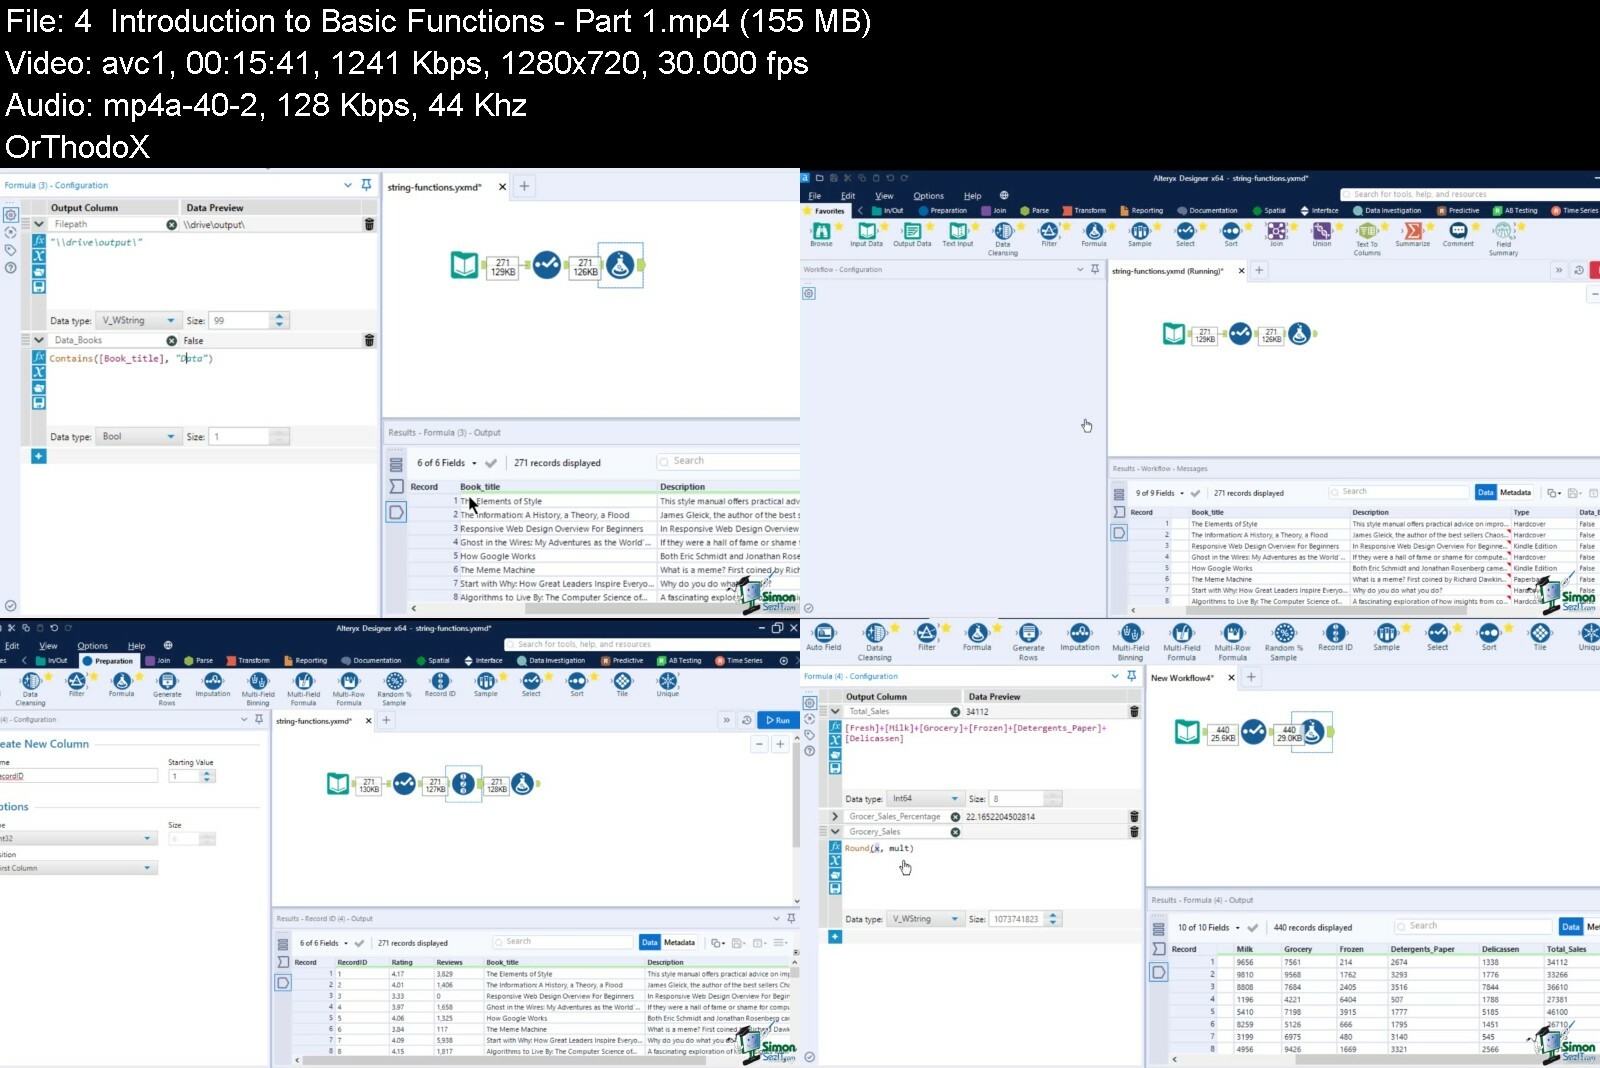
MP4 | Video: h264, 1280x720 | Audio: AAC, 44.1 KHz, 2 Ch
Genre: eLearning | Language: English | Duration: 185 lectures (29h 37m) | Size: 12.3 GB
Get started with Tableau Desktop, Alteryx, Qlik Sense, and Python Pandas in this ultimate six-course bundle!
What you'll learn
The Tableau interface and its major functions
Which data structures are suitable for Tableau
Connect and manage data sources in Tableau
Create a dashboard in Tableau and animate your visualizations
Use calculated fields and spatial functions in Tableau
Level of Detail (LOD) expressions
Advanced filters and table calculations in Tableau
Advanced Tableau charts circular, sunburst, bump, funnel, candlestick, and Sankey charts
Using Alteryx workflows to cut out repetitive tasks
Creating reports in Alteryx that run on demand
Building visual workflows in Alteryx
Building a k-centroid clustering model using Alteryx
Using multiple files and Calgary in Alteryx
All about Machine Learning and the Alteryx Intelligence Suite
Take your apps and macros to the next level in Alteryx
Data cleansing, manipulation, binning, and grouping in Alteryx
How to become a Qlik Sense designer
All about the different charts and graphs available in Qlik Sense
How to create your analysis in the Story Telling tab
How to use the Qlik Sense Geo Analytics tools (maps)
An overview of Pandas and installing Pandas on your computer
Using the two primary Pandas data structures, Series and DataFrame
Viewing data imported from an external source and using Pandas for data preprocessing
Organizing input data using indexing and filtering and formatting your data most efficiently
Processing different data types and data manipulation using string functions
Requirements
Access to the relevant software/application is beneficial (Tableau Desktop, Alteryx, Qlik Sense, Python and Pandas)
An understanding of data analytics is helpful
A fundamental understanding of basic Python syntax to take the Pandas course is needed
Description
** This course bundle includes practice exercises and downloadable data files to work and follow along with, plus LIFETIME access!
In this incredible-value, six-course bundle, learn and master the essential tools that can help turn your large complex data into meaningful visualizations that are easier to understand.
If you want to get started with data analytics and visualization software, then this Data Visualization Toolkit is a good place to begin. This bundle includes six full beginner and advanced courses in Tableau Desktop, Alteryx, Qlik Sense, and Python Pandas.
What's included?
Tableau for Beginners
What Tableau is and the product suite
What business intelligence is
The Tableau interface and its major functions
Which data structures are suitable for Tableau
How Tableau reads and categorizes data
Different data concepts and theory
How to connect and manage data sources in Tableau
How to navigate the Tableau workspace
How to build a view and different chart types in Tableau
How to create a dashboard in Tableau
How to publish and share a workbook
How to use calculated fields in Tableau
How to use numeric, string, conditional, and analytical expressions/functions in Tableau
Introduction to Alteryx
Using Alteryx workflows to cut out repetitive tasks
Building visual workflows in Alteryx
How to make the most of 'Favorite Tools' as core Alteryx building blocks
Filtering data in Alteryx
Using the basic functions in Alteryx to match data
How to dynamically rename datasets
How to parse data in Alteryx
Creating reports in Alteryx that run on demand
Using the predictive tools in Alteryx to perform data analysis
Building a k-centroid clustering model using Alteryx
Creating a logistic regression in Alteryx
Making a decision tree-based regression in Alteryx
Constructing a random forest-based model
Getting Started in Qlik Sense
The difference between Qlik Sense and Qlik View
How to load data in Qlik Sense
How to create and upload apps in Qlik Sense
All about the different charts and graphs available in Qlik Sense
All about Tables and Pivot Tables in Qlik Sense
How to create your analysis in the Story Telling tab
About numeric and string functions in Qlik Sense
How to use the date and time formatting functions
How to use Conditional Functions
How to combine tables using JOIN, KEEP and CONCATENATE
How to use different charts and tables
How to use the Qlik Sense Geo Analytics tools (maps)
Tableau Advanced
Parameters and sample use cases
Level of Detail (LOD) expressions
Working with groups and sets
Use of spatial functions
Advanced filters
Table calculations
How to add interactivity using actions
Animating your visualizations
Advanced Tableau charts circular, sunburst, bump, funnel, candlestick, and Sankey charts
Building geospatial dashboards and sales dashboards
Creating dashboards that utilize radial charts
Alteryx Advanced
Using multiple files and Calgary
Sampling data and using wild matches
Data cleansing, manipulation, binning, and grouping
Using RegEx (regular expressions) and parsing XML
Working with In-Database
Blending, selecting, and summarizing data
Take your apps and macros to the next level
Using iterative and batch macros
Understanding app errors and conditions
Customizing apps and macros
All about Machine Learning and the Alteryx Intelligence Suite
Pandas for Beginners
An overview of Pandas
Installing Pandas on your computer
Using the two primary Pandas data structures, Series and DataFrame
Viewing data imported from an external source
Organizing input data using indexing and filtering
Using Pandas for data preprocessing
Addressing missing values and duplicate rows
Formatting your data most efficiently
Processing different data types
Data manipulation using string functions
Date and time formatting
This course includes
29+ hours of video tutorials
170+ individual video lectures
Certificate of completion
Course and Exercise files to help you follow along
Did you know?
Simon Sez IT teaches all sorts of software, including
Microsoft Excel
Microsoft PowerPoint
Microsoft Word
Microsoft Project
Microsoft Outlook
QuickBooks
Photoshop Elements
Web Development Languages
And so much more!
Who this course is for
Data Analysts and Data Scientists
Anyone looking to turn raw data into meaningful business visualizations
Anyone interested in data visualization
People who are brand-new to Tableau, Alteryx, Qlik Sense, and/or Pandas
Users who have a foundation in Tableau, Alteryx, or Qlik Sense and are seeking to advance their skills
Beginner Python developers and those who want to learn and use Pandas library
https://anonymz.com/?https://www.udemy.com/course/the-complete-data-visualization-toolkit-bundle/
https://rapidgator.net/file/94c444a89c12ff6ea17fc44ff74544eb/The_Complete_Data_Visualization_Toolkit_Bundle.part1.rar
https://rapidgator.net/file/8e367331a9476ff4b22368d67e57c3e0/The_Complete_Data_Visualization_Toolkit_Bundle.part2.rar
https://rapidgator.net/file/19e7584304a27750697a0958b2d0f96e/The_Complete_Data_Visualization_Toolkit_Bundle.part3.rar
https://nitroflare.com/view/08536876D3AB168/The_Complete_Data_Visualization_Toolkit_Bundle.part1.rar
https://nitroflare.com/view/317B8B06AABCEC2/The_Complete_Data_Visualization_Toolkit_Bundle.part2.rar
https://nitroflare.com/view/398ABC73F9C7968/The_Complete_Data_Visualization_Toolkit_Bundle.part3.rar