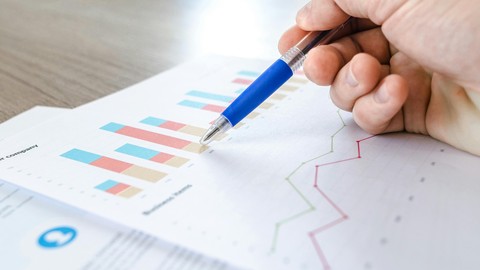
Learn Data Analysis With Excel
Published 4/2024
MP4 | Video: h264, 1920x1080 | Audio: AAC, 44.1 KHz
Language: English
| Size: 525.45 MB[/align]
| Duration: 1h 30m
Starts at the very beginning with Excel and Data Analysis and builds up to a working knowledge
[b]What you'll learn[/b]
Learn the mathematical fundamentals of data analysis
Learn what spreadsheets can do and how they are used
Learn Excel functions related to data analysis
Learn how to mock up data to practice your analytical skills
[b]Requirements[/b]
No coding experience necessary
You need a very basic understanding of math (Addition, Subtraction, Multiplication, Division, and some Algebra(math with parathesis and variables))
You need a computer (not a phone or tablet) with Microsoft Excel
You need an understanding of how calculators work
[b]Description[/b]
This course is for total beginners who haven't spent a great deal of time on Microsoft Excel and are fairly new to data analysis. I teach you the Excel functions that make the complex math simple and efficient, and I guide you through different levels of analysis starting at grade-school level math up to complex analysis and visuals.You will learn:A working understanding of spreadsheetsA working understanding of using Microsoft Excel for analyzing numerical dataExcel functions for quickly performing complex mathBest practices when using excel functionsSelecting the right visuals for what you are trying to displayHow to mock up data for practiceFormatting in ExcelHow to take a different perspective on the same data setHow visualizations don't always deliver the truthand much moreThis course is intended for the self-educator or self-learner who wants to build a working knowledge for their own business or their own personal study. If you are a businessman, this course will save you a lot of money as you won't have to pay a ridiculous amount to marketing companies who don't really understand your business and never will like you do.I hope the course helps you and saves you a lot of time, money, and frustration.
Overview
Section 1: Introduction
Lecture 1 Introduction
Section 2: Exploring Microsoft Excel
Lecture 2 Let's explore Microsoft Excel together
Section 3: Using Excel Functions to Analyze Data
Lecture 3 Doing math in Excel
Lecture 4 Calculating the sum using the SUM() Function
Lecture 5 Calculating the product using the PRODUCT() Function
Lecture 6 Calculating the quotient using the QUOTIENT() Function
Lecture 7 Calculating the mean using the AVERAGE() Function
Lecture 8 Calculating the variance using the VAR.P() Function
Lecture 9 Calculating the standard deviation using the STDEV.P() Function
Lecture 10 Calculating the correlation coefficient using the CORREL() Function
Section 4: Analyzing Data and Creating Visuals
Lecture 11 Scenario: Average Price of a Product
Lecture 12 Scenario: Variance of Sale Prices
Lecture 13 Scenario: Standard Deviation of Sale Prices
Lecture 14 Scenario: What is the correlation between two products?
Lecture 15 Visualizing Sales Data
Lecture 16 Visualizing the Trend with a Line Chart
Lecture 17 Visualizing Multiple Products on the Same Line Chart
Lecture 18 A Different Perspective on Multifaceted Data Sets | Digging A Little Deeper
Section 5: Conclusion
Lecture 19 Review and Constant Practice
Businessmen who wish to further their development and learn how to read their own data and make well-informed decisions (Saves A LOT of money),Students who wish to develop their Excel skills for their career paths.,People with no experience with data or statistical analysis or Microsoft Excel who want to begin learning
https://fikper.com/Z2ej5s5EOW/Learn.Data.Analysis.with.Excel.zip.html
https://rapidgator.net/file/227d4d145086f0e7295fe2f2ff0d429d/Learn.Data.Analysis.with.Excel.zip
Free search engine download скачать: Learn Data Analysis with Excel

