

7.49 GB | 15min 0s | mp4 | 1280X720 | 16:9
Genre:eLearning |Language:English
Files Included :
1 Course Introduction.mp4 (41.33 MB)
2 Why Prometheus.mp4 (97.94 MB)
3 Terminology of Prometheus.mp4 (77.69 MB)
6 Prometheus Architecture Overview.mp4 (150.72 MB)
1 SetUp GO Application.mp4 (99.88 MB)
2 Expose Counter Metric on GO App.mp4 (136.99 MB)
3 Expose Gauge Metric on GO App.mp4 (47.56 MB)
4 Expose Summary Metric on GO App.mp4 (51.69 MB)
5 Expose Histogram Metric on GO App.mp4 (45.2 MB)
1 What to Instrument.mp4 (47.67 MB)
1 Datatypes in PromQL.mp4 (40.03 MB)
2 Selectors and Matchers in PromQL.mp4 (52.33 MB)
3 Binary Operator.mp4 (51.09 MB)
4 Groupers in PromQL.mp4 (58.09 MB)
5 Aggregation operators.mp4 (44.57 MB)
6 PromQL Functions - Part 1.mp4 (91.6 MB)
7 PromQL Functions - Part 2.mp4 (51.68 MB)
1 What is Recording Rule.mp4 (33.86 MB)
2 Reload Prometheus Config at Runtime.mp4 (72.18 MB)
3 Writing Recording Rules.mp4 (82.84 MB)
4 Writing Recording Rules Part 2.mp4 (60.58 MB)
5 Add Multiple Rules.mp4 (75.18 MB)
1 What is Alerting.mp4 (28.3 MB)
2 Writing and Firing the Alert.mp4 (66.07 MB)
3 Avoid False Alerts in System.mp4 (79.73 MB)
4 Add Labels on Alerts.mp4 (157.22 MB)
5 Installing Alert Manager.mp4 (62.77 MB)
6 Adding Alert Notifier - GMAIL.mp4 (55.58 MB)
7 Create GMAIL App Password.mp4 (35.17 MB)
8 Sending Alert Notification - GMAIL.mp4 (39.85 MB)
9 Send Additional Information in Alert.mp4 (62.6 MB)
1 Why do you need Routing Tree.mp4 (39.22 MB)
10 Send Alerts to Multiple StakeHolders.mp4 (78.39 MB)
2 Understanding Routing Tree Use-Case.mp4 (39.29 MB)
3 Prepare Alerting Rules.mp4 (205.18 MB)
4 Implementing the Routing Tree - 1.mp4 (76.57 MB)
5 Implementing the Routing Tree - 2.mp4 (74.9 MB)
6 Implementing the Routing Tree - 3.mp4 (95.22 MB)
7 Run Routing Tree Alerts.mp4 (104.7 MB)
8 Grouping Alerts.mp4 (84.27 MB)
9 Silencing the Alerts.mp4 (69.74 MB)
1 Service Discovery Introduction.mp4 (33.04 MB)
2 File Bases Service Discovery.mp4 (140.46 MB)
1 Grafana and It's Capabilities.mp4 (103.19 MB)
2 Install Grafana and Configure Prometheus with Grafana.mp4 (148.56 MB)
3 Create Custom DashBoard for Prometheus Metrics.mp4 (234.72 MB)
4 Configure Dashboard for Kubernetes Prometheus.mp4 (139.94 MB)
1 Thank You and Bonus Note.mp4 (29.89 MB)
1 What makes Prometheus so Awesome.mp4 (125.25 MB)
2 Understanding Prometheus Metric Types.mp4 (120.6 MB)
3 Understanding Prometheus Metric Types II.mp4 (117.02 MB)
1 Prometheus Installation Overview.mp4 (61.85 MB)
2 Create Cloud Machine for Installation.mp4 (58.5 MB)
4 Install Prometheus on UnixLinux Machines.mp4 (85.65 MB)
5 Explore Prometheus User Interface.mp4 (156.33 MB)
6 Understand the Prometheus Default Configuration.mp4 (92.51 MB)
7 Run Prometheus in Back Ground.mp4 (50.98 MB)
1 Using Prometheus Exporters.mp4 (142.47 MB)
2 Monitoring Linux Servers with Node Exporters.mp4 (60.31 MB)
3 Demo Install and Configure Node Exporter.mp4 (152.23 MB)
4 Demo Configure Multiple Nodes with Node Exporter.mp4 (105 MB)
5 WMI Exporter - Windows Monitoring System.mp4 (29.54 MB)
1 Monitoring MySQL Databases with Prometheus.mp4 (42.39 MB)
2 Using MySQL Exporter.mp4 (39.15 MB)
3 Reload Prometheus Configuration without Restart.mp4 (94.39 MB)
4 Demo Installing MySQL Exporter.mp4 (89.21 MB)
6 Demo Configure MySQL Exporter as System Service II.mp4 (124.82 MB)
1 What is BlackBox Exporter.mp4 (31.83 MB)
2 download скачать and Configure BlackBox Exporter.mp4 (36.01 MB)
3 HTTP Probe Module I.mp4 (42.71 MB)
4 HTTP Probe Module II.mp4 (72.53 MB)
5 HTTP Probe Module III.mp4 (63.68 MB)
6 TCP Probe Module.mp4 (52.72 MB)
7 DNS Probe Module.mp4 (67.72 MB)
8 Scrape Target From Blackbox.mp4 (95.21 MB)
9 Relabelling in Prometheus.mp4 (76.34 MB)
1 Using Prometheus with Kubernetes.mp4 (75.02 MB)
2 Demo Installing Prometheus in Kubernetes.mp4 (188.99 MB)
3 Access Prometheus Installed on Kubernetes Cluster.mp4 (157.15 MB)
4 Explore Prometheus Kubernetes Metrics.mp4 (94.49 MB)
1 Client Libraries and Metric Type.mp4 (44.67 MB)
2 SetUp Python Application For instrumentation.mp4 (73.29 MB)
3 Exposing Metrics using Client Libs.mp4 (58.82 MB)
4 Monitor Application using Prometheus.mp4 (111.77 MB)
5 Expose Counter Metrics.mp4 (80.71 MB)
6 Adding Labels to Exposed Metrics.mp4 (92.86 MB)
7 Expose Gauge Metrics.mp4 (140.38 MB)
8 Expose Summy Metrics.mp4 (74.81 MB)
9 Expose Histogram Metrics.mp4 (120.85 MB)
1 Create a Machine For Docker Application Execution.mp4 (63.97 MB)
2 Adding Instrumentation in Docker Application.mp4 (80.99 MB)
3 Create Docker Image and Execute Application in Container.mp4 (67.99 MB)
4 Monitor Docker Application in Prometheus.mp4 (51.26 MB)]
Screenshot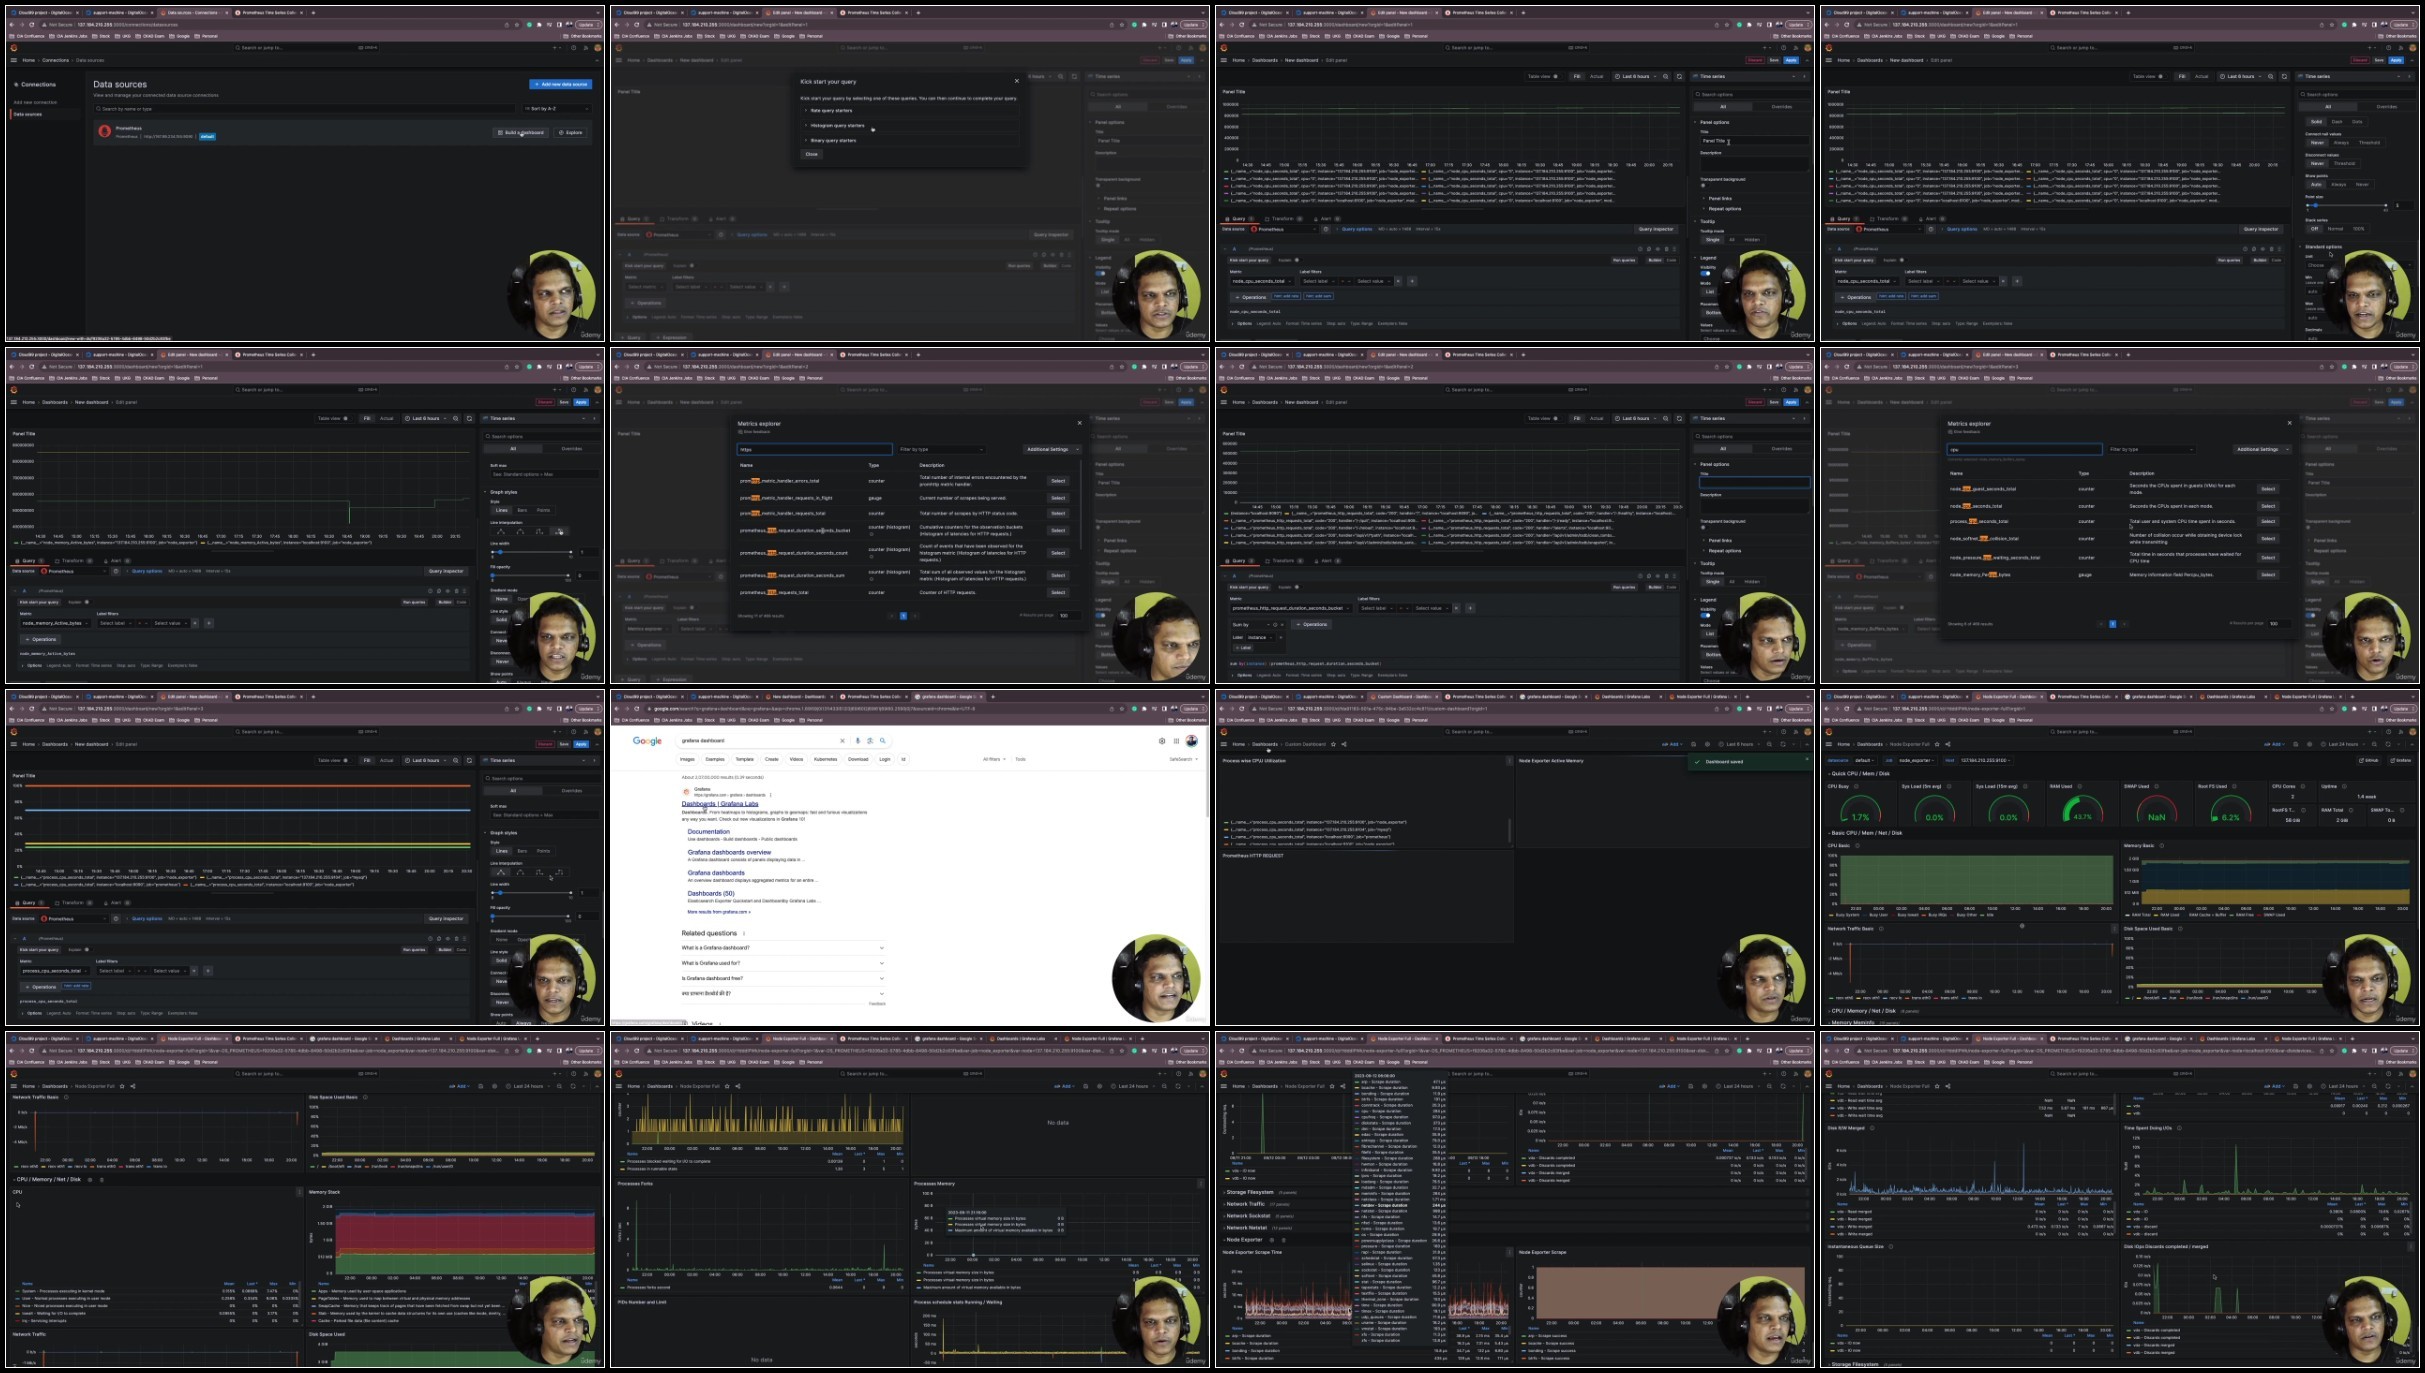
https://fikper.com/Hp3xPbXg0o/
https://fikper.com/fxSwb0Cp59/
https://fikper.com/eUAA5FxZu0/
https://fikper.com/Dq2Onpo51K/
https://rapidgator.net/file/7e472effa680079c7bf052a98f433a48/
https://rapidgator.net/file/f2a6de9ae33a7fd506f96937516c550a/
https://rapidgator.net/file/e48cfcb0734052eaf3c02828e1dcd6b5/
https://rapidgator.net/file/efe70cce0cfc5b359d58c4b59c3b389f/
https://nitroflare.com/view/003ECC25B5E311F/
https://nitroflare.com/view/8C8D54B63CF9377/
https://nitroflare.com/view/1137D01269C7FCE/
https://nitroflare.com/view/F93F21D7C3AD4F6/

