
Process Capability Analysis For Non-Normal Data Using Excel
Published 8/2025
Created by Ray Harkins, The Manufacturing Academy,Michael J. Vella
MP4 | Video: h264, 1280x720 | Audio: AAC, 44.1 KHz, 2 Ch
Level: All | Genre: eLearning | Language: English | Duration: 66 Lectures ( 4h 42m ) | Size: 3.8 GB
Practical Process Capability for Non-Normal Data Using Microsoft Excel - Quality Engineering Made Simple
What you'll learn
Recognize when process data is non-normal and w***t matters in capability analysis
Distinguish between common cause and special cause variation
Apply strategies to eliminate special causes before conducting capability studies
Test for normality using visual methods, the Kolmogorov-Smirnov test, and the Anderson-Darling test in Excel
Identify and verify exponential distributions in real-world process data
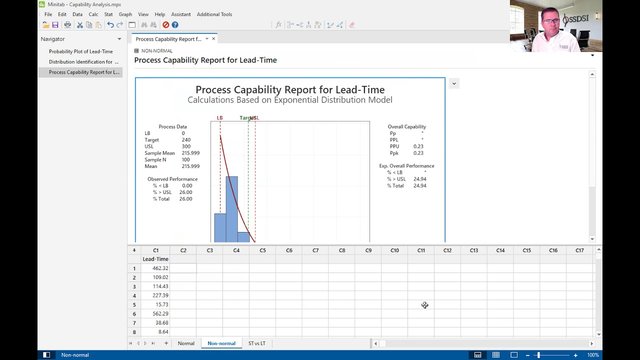
Perform capability analysis for exponential data using Microsoft Excel functions
Use the empirical percentile method to assess capability for other non-normal and non-exponential datasets
Interpret and communicate capability results clearly to stakeholders
Apply both statistical theory and practical Excel skills to real-world quality and reliability problems
Requirements
Basic understanding of descriptive statistics (mean, median, standard deviation)
Familiarity with Microsoft Excel (entering formulas, creating charts, sorting data)
General awareness of process capability concepts (Cp, Cpk, Pp, Ppk) is helpful but not required
Access to Microsoft Excel (2016 or later recommended)
Willingness to work through numerical examples and apply concepts to real data
Description
Most process capability tools assume your data follows a normal distribution-but in the real world, that's often not the case. Many processes produce skewed, multi-modal, or otherwise non-normal data. Applying traditional capability analysis methods without checking this assumption can lead to misleading results and costly decisions.Process Capability Analysis for Non-Normal Data Using Excel gives you a clear, step-by-step method for accurately assessing process capability when your data is not normal. This course blends "on paper" statistical explanations with hands-on Excel demonstrations so you'll not only understand the theory-you'll be able to apply it immediately to your own data.You'll learn how to:Recognize the difference between common and special cause variationEliminate special causes before conducting capability analysisTest for normality using visual methods, the Kolmogorov-Smirnov test, and the Anderson-Darling testIdentify and verify exponential distributions in process dataPerform capability analysis for exponential data using Excel's built-in functionsApply the Empirical Percentile Method as a robust, general-purpose approach for other non-normal and non-exponential data setsWhy take this course?Learn from industry-leading quality engineering professionals with decades of real-world experience in manufacturing, reliability, and data analysisGain both statistical understanding and practical Excel skills you can use immediately in your workAccess OVER 65 downloadable Excel templates to save time and ensure accurate resultsBONUS Glossary of Terminology covering all key terms related to nonnormal capability analysisWork through many realistic, industry-based examples that mirror the challenges you face on the jobEarn a Certificate of Completion to showcase your skills to employers and colleaguesBenefits of enrolling in a Udemy course:Lifetime access - revisit the course anytime as your career growsLearn at your own pace - start, stop, and review lessons as often as you needMobile and TV access - learn anywhere, on any deviceDownloadable resources - keep the tools and templates foreverPeriodic discount coupons for all Manufacturing Academy courses - save a bundle This course is ideal for quality engineers, reliability engineers, data analysts, and technical professionals who want to make better, more data-driven process improvement decisions-without having to purchase specialized statistical software.
Who this course is for
Quality Engineers, Reliability Engineers, Data Analysts, Manufacturing Engineers, Process Engineers
Quality Assurance Specialists, Six Sigma Green Belts, Six Sigma Black Belts, Quality Managers
Operations Managers, Industrial Engineers, Process Improvement Specialists, Supplier Quality Engineers, Statistical Analysts
Quality Technicians, Production Supervisors, Test Engineers, Business Analysts, Continuous Improvement Managers, Metrology Specialists Ask ChatGPT
Buy Premium From My Links To Get Resumable Support and Max Speed
https://rapidgator.net/file/b3dc947c918 … 4.rar.html
https://rapidgator.net/file/a5ca42e81cb … 3.rar.html
https://rapidgator.net/file/466f9ebc8de … 2.rar.html
https://rapidgator.net/file/a28b7f93b0b … 1.rar.html

